Project Overview
This project involved building an interactive Power BI dashboard to monitor sales KPIs, track performance trends, and support data-driven decision-making.
Objective
To design a dynamic reporting solution that enables stakeholders to analyze revenue, profit margins, and product performance in real time.
Dashboard Preview
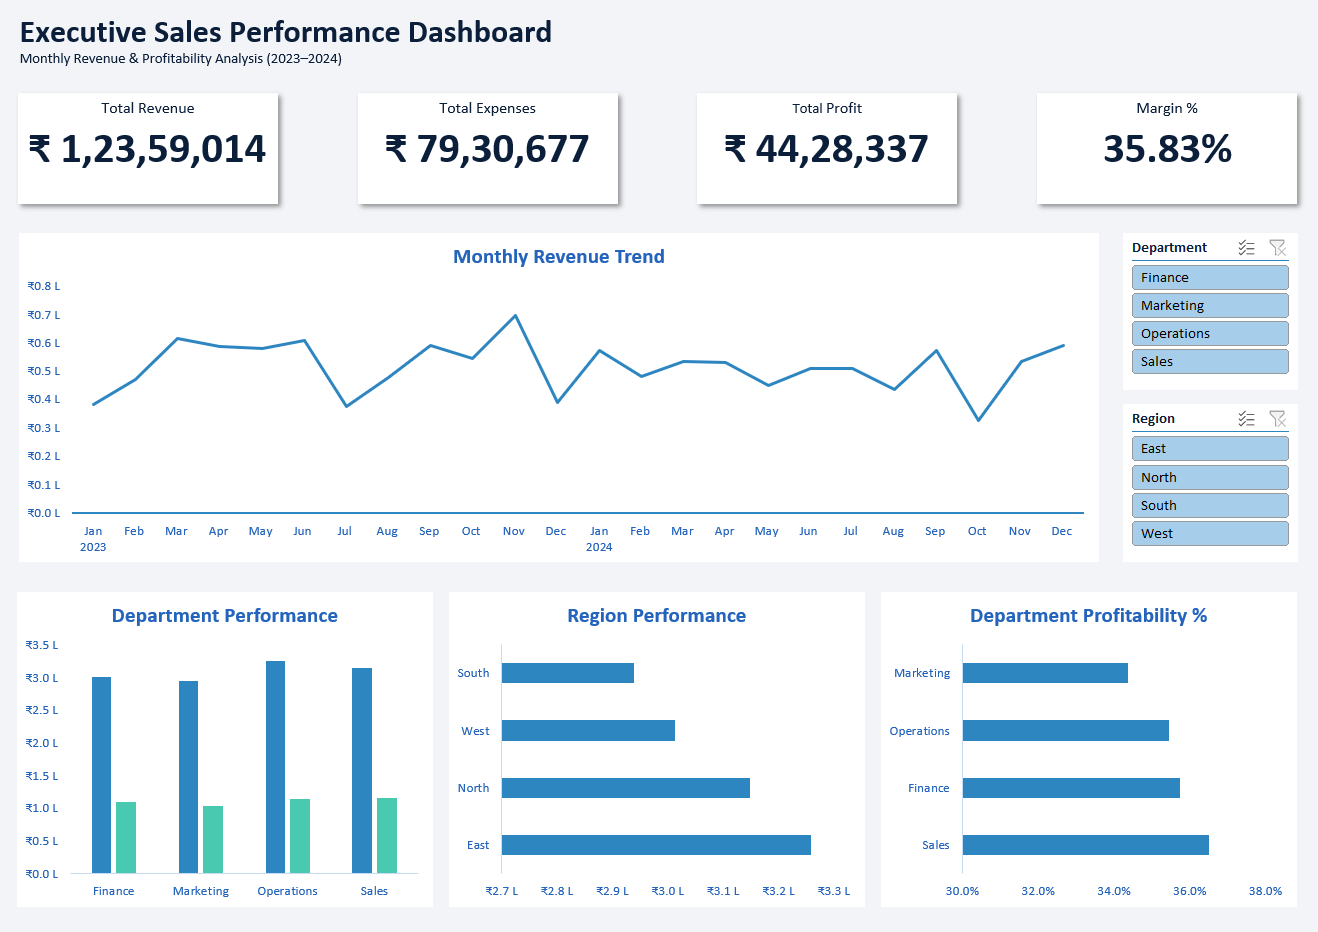
Tools & Technical Implementation
- Power BI Desktop
- Power Query (Data Cleaning & Transformation)
- DAX Measures & Calculated Columns
- Time Intelligence Functions
Key Features Implemented
- Dynamic KPI Cards (Revenue, Profit, Growth %)
- Region-wise Sales Analysis
- Top Performing Products Visualization
- Interactive Filters & Slicers
Key Insights Identified
+22%
Year-over-Year Revenue Growth
15%
Profit Margin Increase
Top 5
Products Contributing 55% Revenue
Business Impact
The dashboard revealed seasonal sales trends and regional performance gaps, enabling improved forecasting, targeted promotions, and optimized inventory planning.