Amit Kumar
SQL | Power BI | Excel | Python
Transforming raw data into meaningful business insights.
About Me
Data Analyst focused on transforming raw data into actionable business insights using SQL, Python, and Power BI. Experienced in data modeling, KPI analysis, and building decision-driven dashboards.
Featured Project
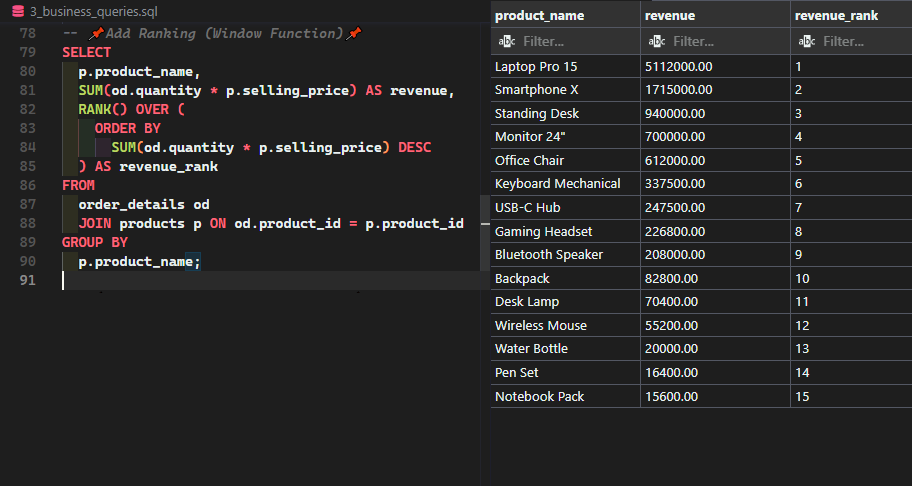
SQL Business Insights
Analyzed relational sales data using advanced SQL techniques to uncover revenue trends, customer lifetime value, and product performance insights.
- 📊 100K+ sales records analyze
- 💰 $10M+ revenue dataset explored
- ⚙ 15+ advanced SQL queries
- 📈 CLV & Pareto analysis implemented
My Data Analytics Journey
Excel Dashboard Analytics
Developed a marketing analytics dashboard calculating CTR, conversion rates, and revenue share analysis.
2025SQL Business Insights
Built a relational database analysis project using advanced SQL queries including window functions, customer segmentation, and Pareto analysis.
2026Skills
Core tools and technologies I use to analyze data, build dashboards, and generate business insights.
0+
End-to-End Dashboards Built
0+
Business Problems Solved
0+
Years of Analytical Practice
Data Analysis
Visualization
Tools & Technology
Business Intelligence
5+
Business-Focused Projects Completed
3+
End-to-End Power BI Dashboards
Advanced SQL
CTEs, Window Functions, Aggregations
Data-Driven
Performance & Revenue Insights
Key Impact
Demonstrating measurable business value through data-driven analysis.
+18%
Revenue growth identified through SQL trend analysis
25%
Improvement in repeat purchase insights via segmentation
60%
Revenue contribution from top customer cohort
3+
End-to-end analytical dashboards built
GitHub Activity
My open-source work and coding activity.
Consistent practice in SQL, Python, and data analysis projects.
Projects
SQL Business Insights
Analyzed relational sales data to uncover revenue trends, customer behavior, and product performance.
- 📊 100K+ sales records analyze
- 💰 $10M+ revenue dataset explored
- ⚙ 15+ advanced SQL queries
- 📈 CLV & Pareto analysis implemented
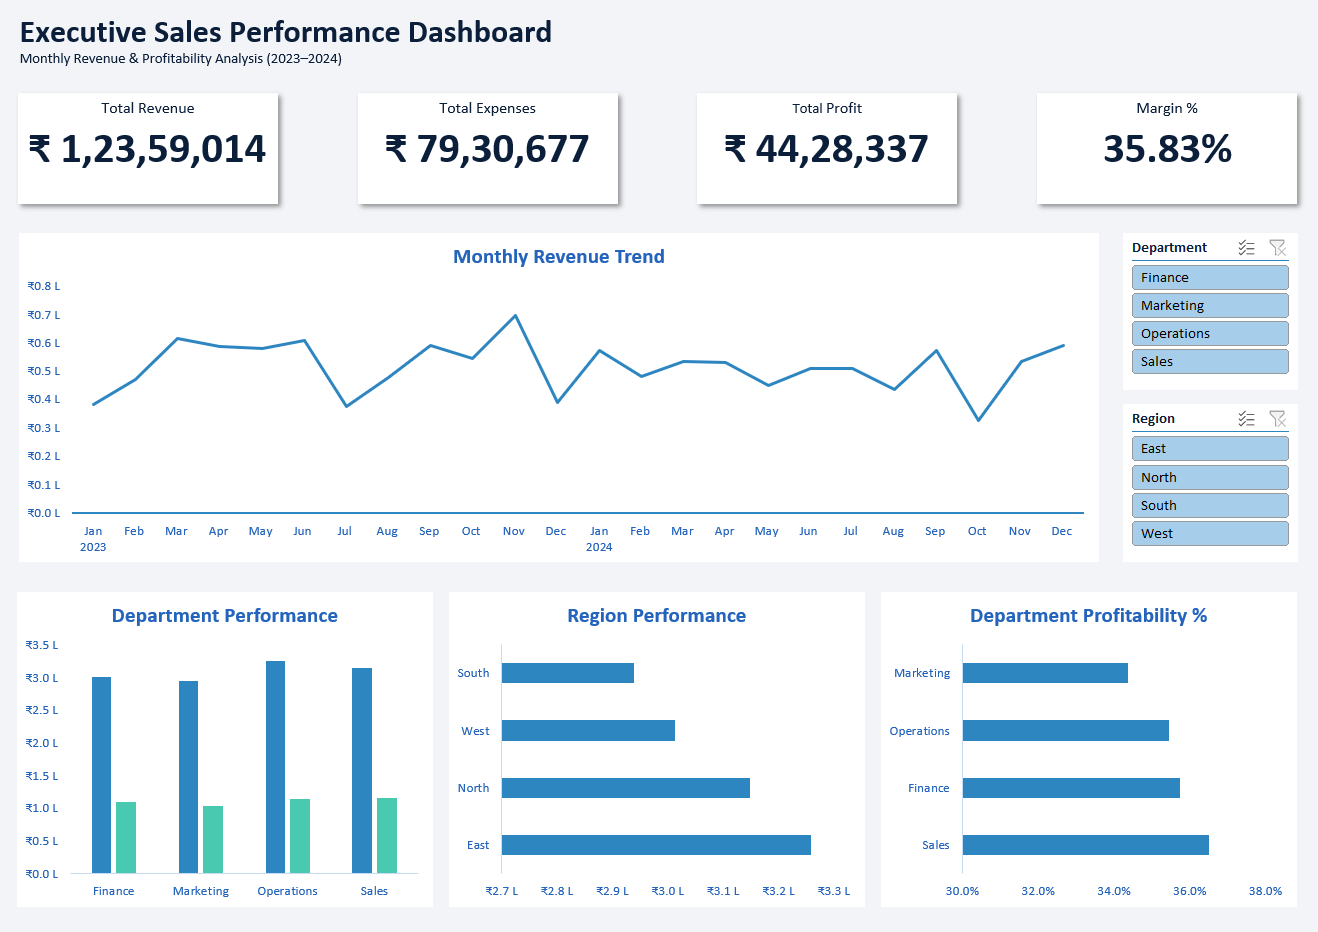
Power BI Sales Dashboard
Interactive KPI dashboard analyzing revenue, profit margin, and top-performing products.
View Case Study →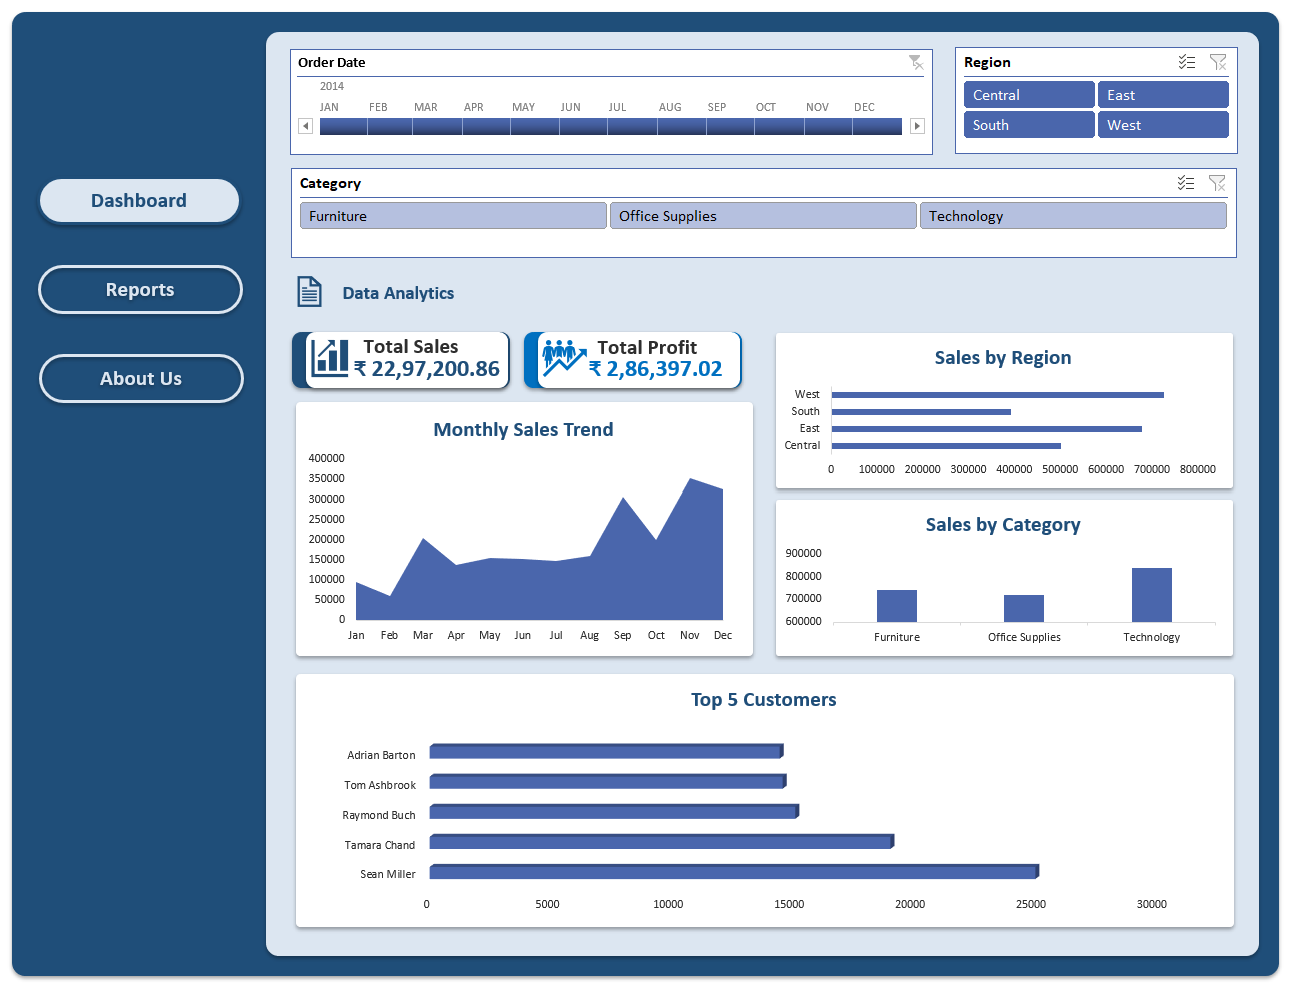
Excel Marketing Funnel
Automated dashboard calculating CTR, conversion rate, and revenue share analysis.
View Case Study →Contact
Let’s build something impactful together.
Work With Me
Whether it's a data analytics project, dashboard development, or collaboration opportunity — feel free to reach out.